1. 가중회귀란?
잔차의 분산이 일정하지 않아서 최소제곱법 가정을 사용할 수 없는 경우에 가중회귀를 사용한다.
가중치를 적절하게 부여하여 가중된 잔차 제곱합을 최소화함으로써 분산이 일정한 잔차를 만들어낼 수 있다.
2. 가중회귀분석
평균이 0이고 분산이 σ2인 정규분포라고 가정했을 때
이 오차항의 분산이 오차항마다 다른 경우

이럴 때 가중최소제곱법을 사용하여 가중값을 제곱하여 적합시킨다.
> x = c(1, 2, 3, 4, 5)
> y = c(2, 3, 5, 8, 7)
> w = 1/x
> # 가중치를 w로 한 가중회귀모형을 적합시키기
> w.lm = lm(y ~ x, weights=w)
> summary(w.lm)

Call:
lm(formula = y ~ x, weights = w)

Weighted Residuals:
         1          2          3          4          5
 8.108e-02 -3.249e-01 -1.076e-16  7.297e-01 -4.835e-01

Coefficients:
            Estimate Std. Error t value Pr(>|t|)
(Intercept)   0.3784     0.6891   0.549   0.6212
x             1.5405     0.2688   5.730   0.0106 *
---
Signif. codes:  0 ‘***’ 0.001 ‘**’ 0.01 ‘*’ 0.05 ‘.’ 0.1 ‘ ’ 1

Residual standard error: 0.5411 on 3 degrees of freedom
Multiple R-squared:  0.9163,	Adjusted R-squared:  0.8884
F-statistic: 32.84 on 1 and 3 DF,  p-value: 0.01055
=> 가중회귀직선 $\hat Y = 0.3784 + 1.5405X$
3. 분석 사례
1) 자료 파일 만들기
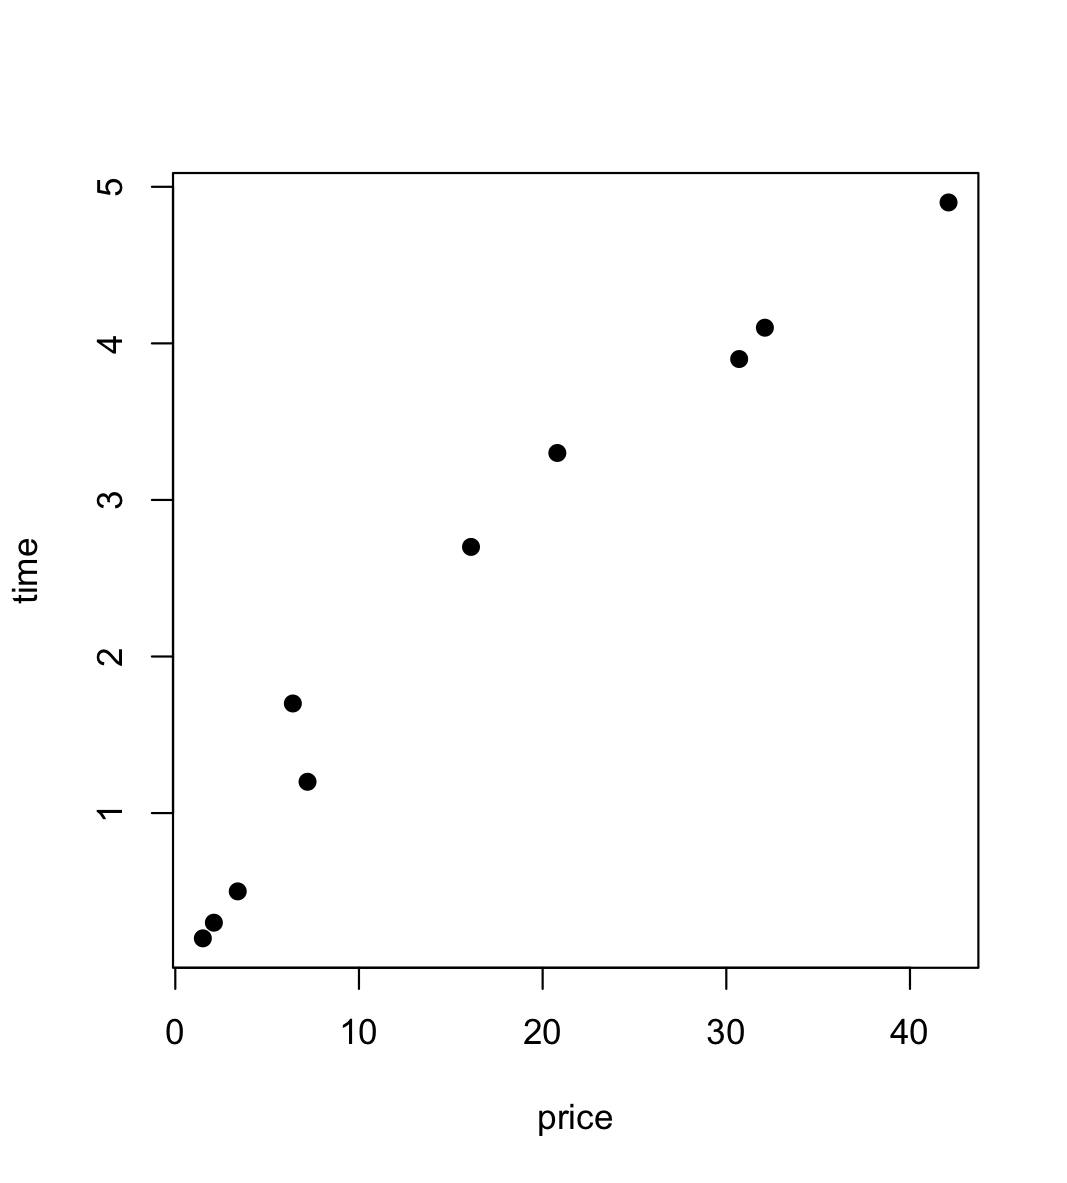
2) 자료 읽어서 산점도 그리기
> super = read.table("/Users/DataAnalytics/RegressionModel/reg/supermarket.txt", header=T)
> head(super)
  price time
1   6.4  1.7
2  16.1  2.7
3  42.1  4.9
4   2.1  0.3
5  30.7  3.9
6  32.1  4.1
> attach(super)
> plot(price, time, pch=19)
3) 회귀모형 적합시키기
> super.lm = lm(time ~ price, data=super)
> summary(super.lm)

Call:
lm(formula = time ~ price, data = super)

Residuals:
     Min       1Q   Median       3Q      Max
-0.37928 -0.32771 -0.04431  0.32231  0.56126

Coefficients:
            Estimate Std. Error t value Pr(>|t|)
(Intercept) 0.396460   0.191488    2.07   0.0722 .
price       0.115982   0.008979   12.92 1.22e-06 ***
---
Signif. codes:  0 ‘***’ 0.001 ‘**’ 0.01 ‘*’ 0.05 ‘.’ 0.1 ‘ ’ 1

Residual standard error: 0.3925 on 8 degrees of freedom
Multiple R-squared:  0.9542,	Adjusted R-squared:  0.9485
F-statistic: 166.9 on 1 and 8 DF,  p-value: 1.221e-06
4) 분산분석표 구하기
> anova(super.lm)
Analysis of Variance Table

Response: time
          Df  Sum Sq Mean Sq F value    Pr(>F)
price      1 25.7036 25.7036  166.85 1.221e-06 ***
Residuals  8  1.2324  0.1541
---
Signif. codes:  0 ‘***’ 0.001 ‘**’ 0.01 ‘*’ 0.05 ‘.’ 0.1 ‘ ’ 1
검정통계량 $F_0 = 166.85$
이에 대한 유의확률 p-value = 1.221x10^(-6)
으로 매우 작기 때문에 적합된 회귀선이 유의하다는 것을 알 수 있다.
5) 잔차 및 추정값 보기
> names(super.lm)
 [1] "coefficients"  "residuals"     "effects"       "rank"          "fitted.values"
 [6] "assign"        "qr"            "df.residual"   "xlevels"       "call"
[11] "terms"         "model"
> cbind(super, super.lm$resid, super.lm$fitted)
   price time super.lm$resid super.lm$fitted
1    6.4  1.7     0.56125840        1.138742
2   16.1  2.7     0.43623742        2.263763
3   42.1  4.9    -0.37928275        5.279283
4    2.1  0.3    -0.34002095        0.640021
5   30.7  3.9    -0.05709314        3.957093
6   32.1  4.1    -0.01946730        4.119467
7    7.2  1.2    -0.03152683        1.231527
8    3.4  0.5    -0.29079696        0.790797
9   20.8  3.3     0.49112416        2.808876
10   1.5  0.2    -0.37043203        0.570432
6) 잔차 그림 그리기
> plot(super$price, super.lm$resid, pch=19)
> abline(h=0, lty=2)
> plot(super.lm$fitted, super.lm$resid, pch=19)
> abline(h=0, lty=2)
잔차는 0을 중심으로 일정한 범위 내에 있기 때문에 회귀에 대한 기본 가정을 만족한다고 말할 수 있다.
하지만 X가 증가함에 따라 곡선관계를 보여주고 있기 때문에 2차곡선 회귀식을 구해볼 수 있다.
7) 추정값의 신뢰대 그리기
> p.x=data.frame(price=c(1,45))
> pc=predict(super.lm, int="c", newdata=p.x)
> pred.x = p.x$price
> plot(super$price, super$time, ylim=range(super$time, pc), pch=19)
> matlines(pred.x, pc, lty=c(1,2,2), col='BLUE')
반응형
'Data Science > Regression Analysis' 카테고리의 다른 글
| [Regression] 표준화된 중회귀분석 (0) | 2022.04.01 |
|---|---|
| [Regression] 중회귀모형 (0) | 2022.03.31 |
| [Regression] 회귀계수의 신뢰구간 및 검정 방법 (0) | 2022.03.30 |
| [Regression] 회귀모형의 평가 분산분석(ANOVA) (0) | 2022.03.11 |
| [Regression] 회귀선의 추정 (0) | 2022.03.09 |


댓글