1. 단변량 그래프
먼저 빈도표를 구해야 한다. 빈도표를 구해서
| Python | R | |
| 캔버스 분할 |
plt.figure() plt.subplot(121)
|
par(mfrow=c(1,2))
|
| 새 창에서 그리기 |
dev.new() dev.off()
|
|
| 그래프 이름 |
title("Education of Female")
|
|
| 대화형 그래프 |
identify(x)
|
|
| 빈도수 막대그래프 |
plt.bar(edu_freq.index, edu_freq["count"])
|
barplot(edu_tb)
|
| 빈도표 겹친막대그래프 |
edu_sex_tb.plot.bar(stacked=True)
|
barplot(sex_edu_tb, legend.text=rownames(sex_edu_tb), col=c(2,4))
|
| 원그래프 |
plt.pie(edu_freq["count"], labels=edu_freq.index)
|
pie(edu_tb, main="Education level diagram")
|
| 히스토그램 |
plt.hist(survey.salary)
|
hist(survey$salary)
|
| 줄기잎그래프 |
stemgraphic.stem_graphic(survey.salary, scale=50)
|
stem(survey$salary, scale=2)
|
| 상자그림 | sns.boxplot(x="sex", y="salary", data=survey) |
boxplot(salary ~ sex, data=survey) # sex salary
|
1) R
- R 막대그림 및 원그림
> #단변량 그래프
> survey = read.csv("/Users/DataAnalytics/MultivariateAnalysis/mva/survey.csv")
> edu_tb = table(survey$edu)
> edu_tb

 1  2  3  4  5
 1  1  3 19 16
> rownames(edu_tb) = c("none","es", "ms","hs","ac")	#"무학","초졸", "중졸","고졸","대졸"
> barplot(edu_tb)
> barplot(edu_tb)
> dev.new()
NULL
> pie(edu_tb, main="education level diagram")
> dev.off()
RStudioGD
        2

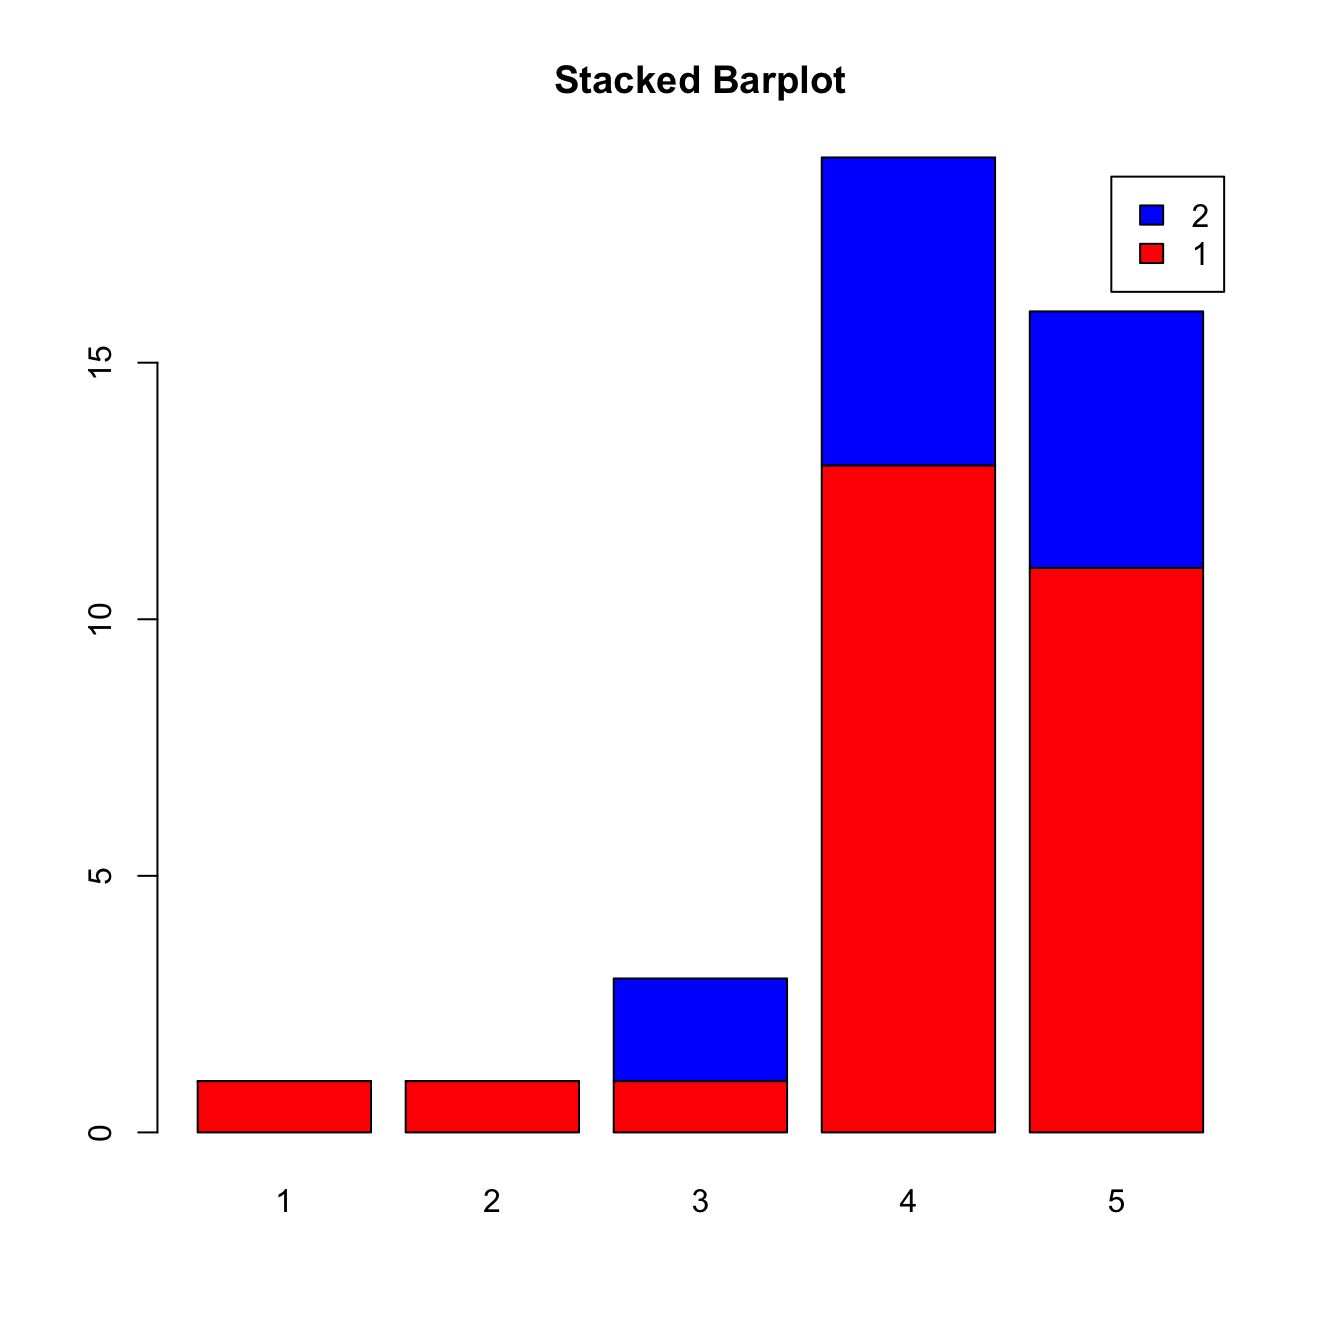
- R 겹친막대그림
> sex_edu = list(survey$sex, survey$edu)
> sex_edu_tb = table(sex_edu)
> sex_edu_tb
         sex_edu.2
sex_edu.1  1  2  3  4  5
        1  1  1  1 13 11
        2  0  0  2  6  5
> barplot(sex_edu_tb, legend.text=rownames(sex_edu_tb), col=c(2,4))
> title("Stacked Barplot")
- par() : 한 화면에 여러 개의 그림 그리기
> par(mfrow=c(1,2))
> pie(sex_edu_tb[1,])
> title("Education of Male")
> pie(sex_edu_tb[2,])
> title("Education of Female")
- R 히스토그램, 줄기-잎 그림
> hist(survey$salary)
> stem(survey$salary)

  The decimal point is 2 digit(s) to the right of the |

  0 | 555666677788889
  1 | 00000122233
  1 | 55579
  2 | 000123
  2 | 5
  3 | 0
  3 | 5

> stem(survey$salary, scale=2)

  The decimal point is 1 digit(s) to the right of the |

   4 | 000
   6 | 0000000
   8 | 00000
  10 | 000000
  12 | 00000
  14 | 000
  16 | 0
  18 | 0
  20 | 0000
  22 | 00
  24 | 0
  26 |
  28 |
  30 | 0
  32 |
  34 | 9
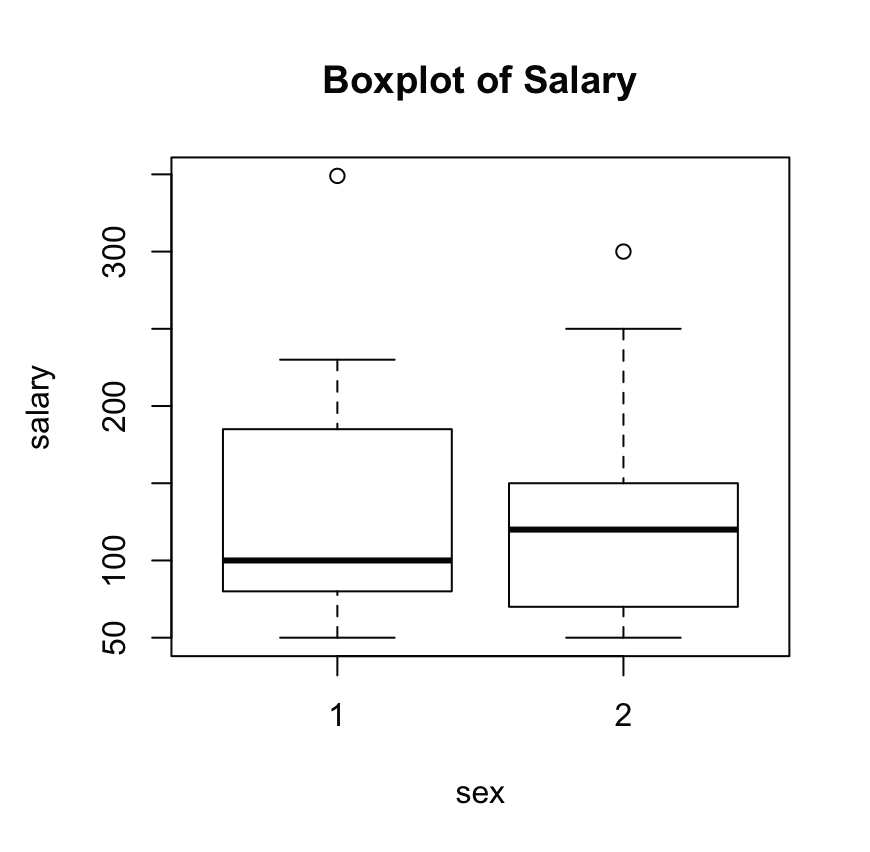
- R 상자그림
> boxplot(salary ~ sex, data=survey)
> title("Boxplot of Salary")
2) Python
https://colab.research.google.com/drive/19Ex0LqUkU1OrG-qdpJU2lNsyIHS04_QZ?usp=sharing
UnivariateBivariateMultivariate.ipynb
Colaboratory notebook
colab.research.google.com
import numpy as np
import pandas as pd
import matplotlib.pyplot as plt
# 데이터 읽기
survey = pd.read_csv("/content/drive/MyDrive/DataAnalytics/MultivariateAnalysis/mva/survey.csv")
# 빈도수 구하기
edu_freq = pd.crosstab(index=survey.edu, columns='count')
edu_freq

# 케이스 라벨 지정하기
edu_freq.index = ["none", "elementary", "middle", "high", "college"]
edu_freq
plt.figure()
plt.subplot(121)
plt.bar(edu_freq.index, edu_freq["count"])
plt.subplot(122)
plt.pie(edu_freq["count"], labels=edu_freq.index)

# (edu, sex) 분할표 구하기
edu_sex_tb = pd.crosstab(index=survey.edu, columns=survey.sex)

# 케이스 및 변수이름 지정하기
edu_sex_tb.index = ["none", "elementary", "middle", "high", "college"]
edu_sex_tb.columns = ["Male", "Female"]
edu_sex_tb

# 겹친 막대그림 그리기
edu_sex_tb.plot.bar(stacked=True)


import matplotlib.pyplot as plt
# 히스토그램 그리기
plt.hist(survey["salary"])
# help(plt.hist)

# 줄기-잎 그림 그리기
# pip install stemgraphic (in DOS prompt)
import stemgraphic
stemgraphic.stem_graphic(survey.salary, scale=50)

import seaborn as sns
sns.boxplot(x="sex", y="salary", data=survey)


* 아래 stemgraphic install 하는 부분은 무슨 이유에서인지는 아무리 분석해봐도 모르겠으나
한꺼번에 쓰면 에러가 난다.
절대로 오타가 없는데 sintax 에러가 나는 이상한 버그
아무튼 따로따로 써주면 간편하게 해결된다.


반응형
'Data Science > Multivariate Analysis' 카테고리의 다른 글
| [Multivariate Analysis] Principal Component Analysis(PCA) 주성분분석 (0) | 2022.03.18 |
|---|---|
| [Mulivariate Analysis] eigenvalue(고유값)과 eigenvector(고유벡터) (0) | 2022.03.18 |
| [Multivariate Analysis] 다차원 통계그래프 (0) | 2022.03.13 |
| [Multivariate Analysis] 이변량 통계그래프 (0) | 2022.03.13 |
| [Multivariate Analysis] 기술통계량 및 분할표 (0) | 2022.03.12 |


댓글